

We are happy to announce SBOMscanner
v0.13.0!
The highlight of this release is
OpenTelemetry
support. SBOMscanner now exports traces and metrics for every component,
from the admission webhook down to the SQL statements of the storage layer.
The release also brings plain-HTTP support for insecure registries, better
image discovery for workloads, and a cleaner registry catalog.
Why telemetry?
A scan in SBOMscanner is a chain of messages over NATS JetStream. The controller publishes work for the workers, and the workers publish the next stage to each other: one message per image to generate an SBOM, one per SBOM to scan it. The results go to the storage API server, which stores them in PostgreSQL and notifies the other components over NATS.
flowchart LR
    C[Controller]
    N[NATS JetStream]
    W[Workers]
    S[Storage API server]

    C -- create catalog --> N
    N -- scan messages --> W
    W -- next stage --> N
    W -- write reports --> S
    S -- watch events --> N
    N -. watch events .-> C
Every step is asynchronous, and a scan of a large registry spreads over hundreds of messages and several worker replicas. When a scan is slow or fails, the logs of five components are a hard place to look for the cause.
With v0.13.0, you can follow one scan as one trace, and you can watch the
health of the system with a small set of metrics. All of it uses the
OpenTelemetry standard, so it works with the collector and the backends you
already run.
One scan, one trace
Each scan produces exactly one trace. The trace starts when the job is
created, by the admission webhook or by the scheduled runner. SBOMscanner
stores the trace context on the job object in the
sbomscanner.kubewarden.io/traceparent annotation. From there, the context
travels in the headers of every NATS message, from the controller to the
workers and from worker to worker. It also travels in the HTTP requests to
the storage API server.
The result is a single tree of spans for the whole scan:
- the webhook decision and the reconcile of the
ScanJob, - one consumer span per NATS message a worker handles (catalog, SBOM generation, vulnerability scan),
- one span per Trivy invocation and per registry call,
- one span per storage operation, down to each SQL query and each NATS watch event.
You can also join a scan to your own trace. If your client already carries a
trace, set the traceparent annotation on the new ScanJob. SBOMscanner
never overwrites it, so the whole scan becomes part of your trace.
Log lines carry the trace ID too. When you find a slow span, you can jump to the exact log lines that belong to it.
Metrics for scans and components
Every component exports metrics over OTLP. The most useful ones are:
- Scan counters:
sbomscanner.scanjobsandsbomscanner.nodescanjobscount finished jobs by result (completeorfailed). Registry scans and workload scans are separated by thesourcelabel. - Images scanned:
sbomscanner.images.scannedcounts scanned images per registry host and result. - Stage durations:
worker.scan.durationis a histogram of each worker stage.worker.trivy.durationandworker.registry.call.durationshow where the time goes inside a stage. - Storage:
storage.apiserver.request.durationandstorage.watch.eventsshow the load on the storage layer. The database client and connection pool metrics come with them. - Runtime: every replica exports process and Go runtime metrics, so you can size the components.
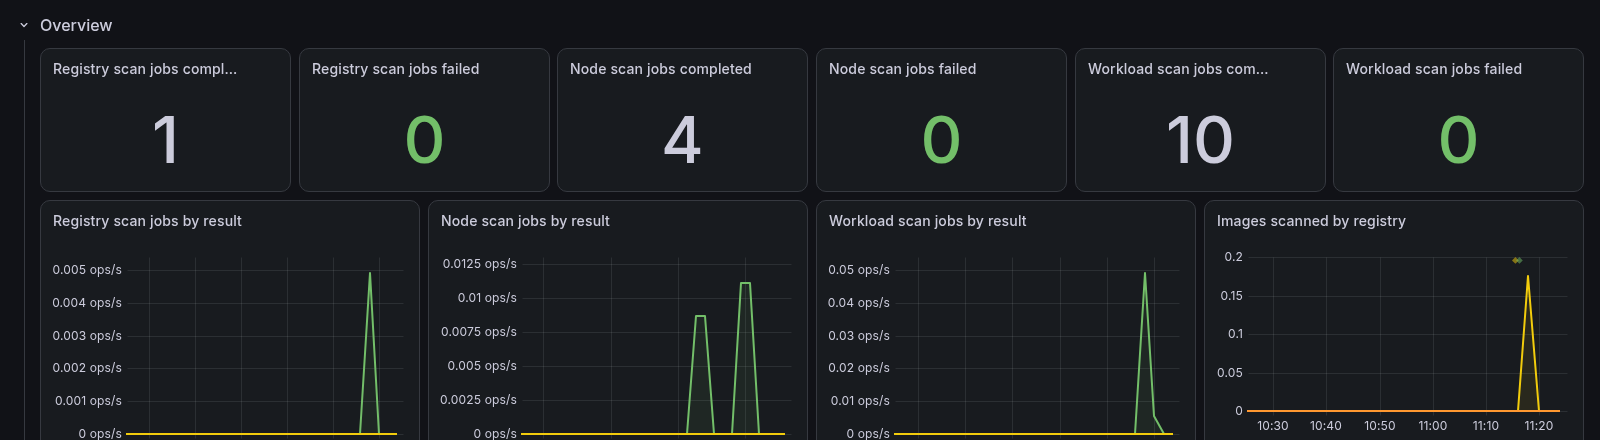
The histograms carry exemplars. An exemplar is one real measurement tagged with the trace ID that produced it. In a backend that supports exemplars, you can click a slow point on a latency panel and land in the trace that caused it.
The full list of spans and metrics, with their attributes and labels, is in the OpenTelemetry reference.
Getting started
Telemetry export is off by default. To enable it, set the otel.endpoint
chart value to the URL of your OTLP/gRPC receiver:
helm upgrade --install sbomscanner sbomscanner/sbomscanner \
  --namespace sbomscanner \
  --set otel.endpoint=https://otel-collector.telemetry.svc.cluster.local:4317
The URL scheme selects the transport security. Use https:// to enable TLS.
Do not use an http:// endpoint in production. Plaintext OTLP sends your
telemetry unencrypted over the network.
Mutual TLS
Two more chart values configure mutual TLS between SBOMscanner and the collector:
otel.caSecretName: a secret with aca.crtkey. SBOMscanner uses it to verify the server certificate of the endpoint.otel.clientCertificateSecretName: a secret withtls.crtandtls.keykeys. SBOMscanner presents them as its client certificate.
With cert-manager, one Certificate produces a
secret that serves both values, because the secret also contains the CA of
the issuer:
apiVersion: cert-manager.io/v1
kind: Certificate
metadata:
  name: sbomscanner-otel-client
  namespace: sbomscanner
spec:
  secretName: sbomscanner-otel-client
  commonName: sbomscanner
  usages:
    - client auth
  issuerRef:
    kind: ClusterIssuer
    name: my-ca-issuer
helm upgrade --install sbomscanner sbomscanner/sbomscanner \
  --namespace sbomscanner \
  --set otel.endpoint=https://otel-collector.telemetry.svc.cluster.local:4317 \
  --set otel.caSecretName=sbomscanner-otel-client \
  --set otel.clientCertificateSecretName=sbomscanner-otel-client
The collector must present a server certificate from the same issuer and
require client certificates. For the OpenTelemetry Collector, set
cert_file, key_file, and client_ca_file on the OTLP receiver.
Histograms
SBOMscanner exports exponential histograms. Prometheus stores them as native histograms. If your backend does not support them, convert them in the collector with the transform processor:
processors:
  transform:
    metric_statements:
      - context: metric
        statements:
          - convert_exponential_histogram_to_histogram("midpoint", [0.05, 0.1, 0.5, 1, 5, 30, 120])
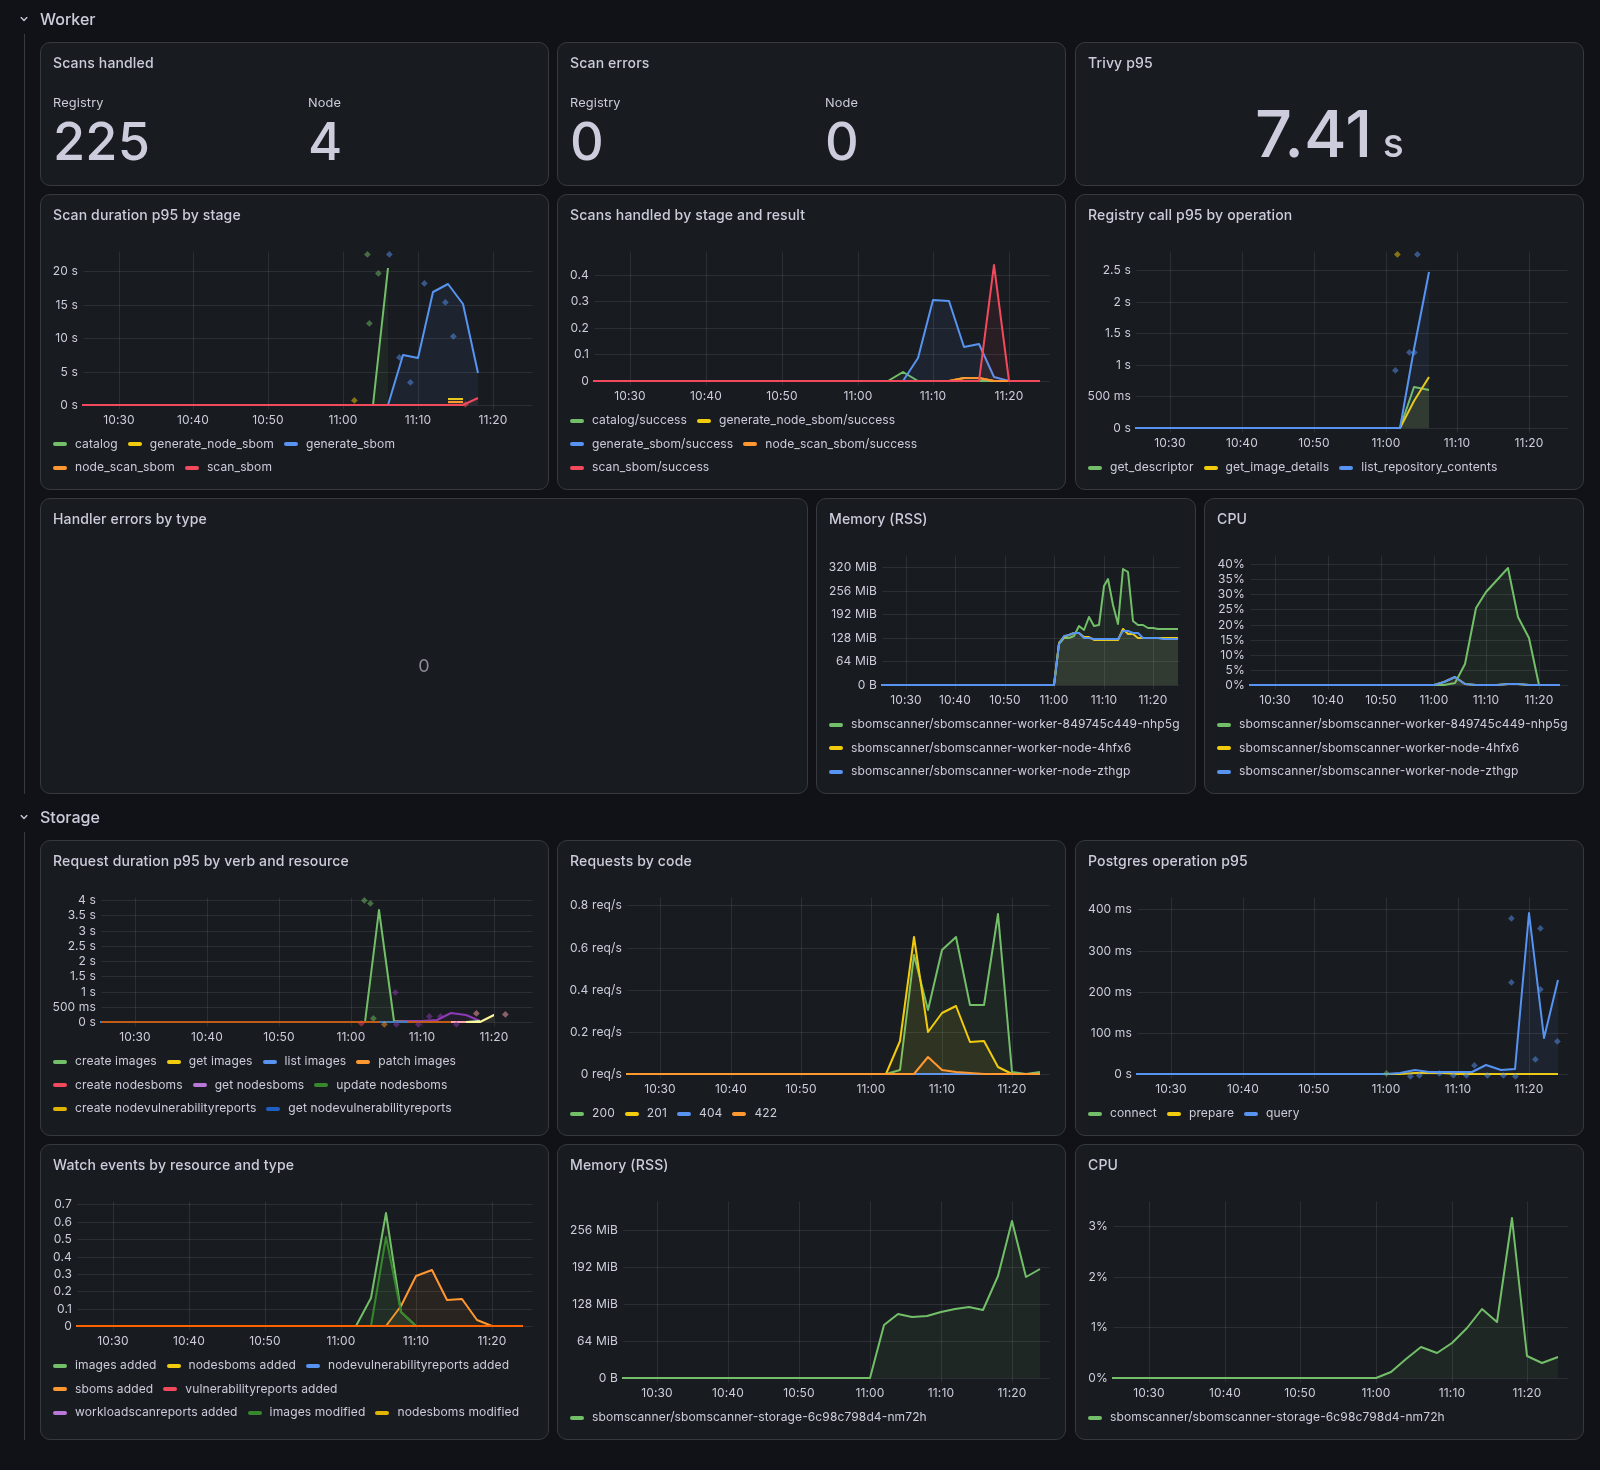
Example dashboard
The repository ships an example Grafana dashboard in
examples/dashboards/sbomscanner.json.
It shows the scan counters, the stage durations, the storage metrics, and
the resource usage of each replica. The latency panels have exemplars
enabled, so one click takes you from a data point to its trace.
Other changes
- Insecure registries over plain HTTP: a
Registrywithspec.insecure: truenow also accepts a plain-HTTP connection, not only a TLS connection with an untrusted certificate. This is useful for local and air-gapped registries. - Digest-pinned workload images: workload scans now discover images that a Pod references by digest instead of by tag.
- Cleaner catalogs: the registry catalog skips cosign signatures and attestations, so they no longer appear as images to scan.
- NodeScanConfiguration defaults: a defaulter webhook fills in the
default values of a
NodeScanConfiguration, and validation rejects invalid attributes at admission time.
Getting in touch
Give SBOMscanner v0.13.0 a try and tell us what you see in your traces.
Feedback from real clusters drives the roadmap.
Join the conversation on Slack or GitHub discussions.
We would love to hear from you!